vpFREE2 Forums

Long Run Index, N0

--- In vpFREE@yahoogroups.com, "nightoftheiguana2000"
<nightoftheiguana2000@y...> wrote:

wrote:
> What I was trying to say regarding the value of 102.28% should

have

> read 103.28% which is at three SD positive. And then I was

trying

> to say that 83.865% (100 -99.73)/2 = 0.135%= area under the tail
> beyound 3SD, therefore 84.000-0.135 = 83.865% of the time your ER
> would range from even to 103.28% ER
>
> Did I get it correct that time?

-1sd to +3sd would be 100% to 103.04%
the area under that region would be 68.27/2 + 99.73/2 = 84%

In my post I stated:

Assume: Normal Distribution
FPDW
ER = 100.76%
SD at NO = .76%
6SD = 99.73% of area under bell curve

I will add: Assume plus/minus one SD = 68%

Then how did you get your numbers.

Remember you are talking to a person who wants to learn, but cannot
get much from just having numbers flashed at him.

My question asked what is the percentage from minus one SD to 3
positive SD

···

--- In vpFREE@yahoogroups.com, "deuceswild1000" <deuceswild1000@y...>

deuceswild1000 wrote:
In my post I stated:
Assume: Normal Distribution
FPDW
ER = 100.76%
SD at NO = .76%
6SD = 99.73% of area under bell curve
I will add: Assume plus/minus one SD = 68%
Then how did you get your numbers.
Remember you are talking to a person who wants to learn, but cannot
get much from just having numbers flashed at him.
My question asked what is the percentage from minus one SD to 3
positive SD

···

=====================================================
I think nightoftheiguana2000 has answered this, but let me try a
slightly different approach.
Suppose a casino had a contest for 10,000 people. Each person gets
to play 444,976 hands. They want to know what to expect in terms of
EV, which can then be translated to cash. With the above
assumptions we would get:
(1) 3413 (34.13%) contestants would be between 100.76% and 100.76% +
0.76% = 101.52%. Also, 3413 contestants would be between 100.76%
and 100.76% - 0.76% = 100%. This is your 68% mentioned above.

(2) 1359 (13.59%) contestants would be between 101.52% and 100.76% +
2(0.76%) = 102.28%. Also, 1359 contestants would be between 100%
and 100.76% - 2(0.76%) = 99.24%.

(3) 215 (2.15%) contestants would be between 102.28% and 100.76% + 3
(0.76%) = 103.04%. Also, 215 contestants would be between 99.24%
and 100.76% - 3(0.76%) = 98.48%.

Now (1), (2), and (3) represent +/- 3sd (which you mentioned as 6SD
above). There would also be 13 lucky contestants above 103.04% and
13 unlucky contestants below 98.48%.
If we add the people from minus 1sd to plus 3sd, we get
3413 + 3413 + 1359 + 215 = 8400, which represents 84% of the
contestants (as reported by nightoftheiguana2000).
Jeff

--- In vpFREE@yahoogroups.com, "nightoftheiguana2000"
<nightoftheiguana2000@y...> wrote:

wrote:
> What I was trying to say regarding the value of 102.28% should

have

> read 103.28% which is at three SD positive. And then I was

trying

> to say that 83.865% (100 -99.73)/2 = 0.135%= area under the

tail

> beyound 3SD, therefore 84.000-0.135 = 83.865% of the time your

ER

···

--- In vpFREE@yahoogroups.com, "deuceswild1000" <deuceswild1000@y...>
> would range from even to 103.28% ER
>
> Did I get it correct that time?

*********************************************************************
NOTI posted

-1sd to +3sd would be 100% to 103.04%

Yes I (had 103.28%) made a transposition error. Wish you had
pointed
out my error here by showing your math. It should be 103.04%

NOTI further posted

the area under that region would be 68.27/2 + 99.73/2 = 84%

I agree thanks to Jeff. (Jeff,we both used the same approach, just
had
silightlly different number in our calculations. See below.

NOTI we had been bandying about 84% from previous posts where +/-
1SD was
68% and not 68.27 as now stated. Thus leaving 16% on either side to
inifinity. I can only assume you meant infinity when you
stated "For
a positive expectation gamble of N0 hands, you will be positive
(net win) 84% of the time." (see post 55160) If you did not mean
positive infinity, then start over in your explanation.

So when we use more precise numbers (thanks again for Jeff's
explanation) It does come up 84% for the area from - 1SD to +3SD
insteasd of the 83.865. which was derived by [the area from-1SD to
pos. infinity = 84% {from previous posting}] - (99.73/2)= 84-0.135
= 83.865 that I used as a means of asking if I understood the
concept correctly. This was all based on the approximation that 84%
ran from -1SD to + inifinity. I knew that it was only an
approximation, but was concentrating on concept rather than tiny
numbers. I felt that the question about the area from -SD to +3SD
would tie down the concept and not result in an answer that was not
clear.

Using number to explain answers helps understanding. Especially
when
concept is the main undertaking and not debating numbers.

I think the lesson we learned here is to not use appromimations and
not to assume anything.

I would like to thank Jeff for clearing up things, and also thank
Harry for communicating off forum for clarification. Finally, NOTI
I would like to thank you for your contributions of knowledge to
this group and at the same time urge you to put your self in the
place of a person who is trying to learn but needs it spelled out in
more basic terms.

DWK

--- In vpFREE@yahoogroups.com, "jeffcole2003oct" <jeff-cole@c...>
wrote:

I think nightoftheiguana2000 has answered this, but let me try a
slightly different approach.
Suppose a casino had a contest for 10,000 people. Each person gets
to play 444,976 hands. They want to know what to expect in terms

of

···

EV, which can then be translated to cash. With the above
assumptions we would get:
(1) 3413 (34.13%) contestants would be between 100.76% and 100.76%

+

0.76% = 101.52%. Also, 3413 contestants would be between 100.76%
and 100.76% - 0.76% = 100%. This is your 68% mentioned above.

(2) 1359 (13.59%) contestants would be between 101.52% and 100.76%

+

2(0.76%) = 102.28%. Also, 1359 contestants would be between 100%
and 100.76% - 2(0.76%) = 99.24%.

(3) 215 (2.15%) contestants would be between 102.28% and 100.76% + 3
(0.76%) = 103.04%. Also, 215 contestants would be between 99.24%
and 100.76% - 3(0.76%) = 98.48%.

Now (1), (2), and (3) represent +/- 3sd (which you mentioned as 6SD
above). There would also be 13 lucky contestants above 103.04% and
13 unlucky contestants below 98.48%.
If we add the people from minus 1sd to plus 3sd, we get
3413 + 3413 + 1359 + 215 = 8400, which represents 84% of the
contestants (as reported by nightoftheiguana2000).
Jeff

I did not follow this thread in detail, so I may be off base a tad.
But I thought I'd mention something I believe relates to it. I was
looking at the 2003 edition of the Penguin Dictionary of Mathematics
at Borders yesterday. In their definition of the Central Limit
Theorem is this quote: "The main condition (for its application) is
that the variance of any one variable should not dominate." Since
the variance of a "no win" situation is very low, and thus
dominates ... it happens almost 50% of the time, and the variance of
a RF is extremely high relative to the other hands, is it valid to
apply the CLT to VP?

Personally, I think it is, but only for sample sizes hundreds of
times larger than the stat books suggest are needed for it to apply.
Why? Because I've run tests using BDPW that suggest it does apply.
But I've yet to see an adequate explanation of why it does.

I wrote:
<snip> With the above assumptions we would get: <snip>
[The most important was the assumption that the normal distribution
holds for the question posed by deuceswild1000.]

···

================================================================
brumar_lv wrote:
I did not follow this thread in detail, so I may be off base a tad.
But I thought I'd mention something I believe relates to it. I was
looking at the 2003 edition of the Penguin Dictionary of Mathematics
at Borders yesterday. In their definition of the Central Limit
Theorem is this quote: "The main condition (for its application) is
that the variance of any one variable should not dominate." Since
the variance of a "no win" situation is very low, and thus
dominates ... it happens almost 50% of the time, and the variance of
a RF is extremely high relative to the other hands, is it valid to
apply the CLT to VP?

Personally, I think it is, but only for sample sizes hundreds of
times larger than the stat books suggest are needed for it to
apply.
Why? Because I've run tests using BDPW that suggest it does apply.
But I've yet to see an adequate explanation of why it does.

In message #48297, cdfsrule said that the CLT does not apply to VP.
However, this was debated by others (nightoftheiguana2000 and JBQ
for sure), and I'm not sure there was ever a definitive conclusion
drawn.
In one of my resources (Devore's Prob. and Stats. text), it says
that if the underlying distribution is far from bell-shaped (as in
VP), then a large N (N is the number of hands played) will be
required. How large? For P (in this context, P is the probability
of a RF) near 0 or 1, if both NP >= 5 and N(1 - P) >= 5, the normal
approximation to the binomial distribution can be used.
For this discussion, the "5" can be thought of as royal cycles (say
40,000 hands or so, depending on the game). My take on this is the
same as brumar_lv's, that is, that the normal distribution will give
us a great APPROXIMATION for sufficiently large N, but I think the N
must be more like 50 cycles, not 5.
I hope some of the stats experts can revisit this and possibly
supply the explanation that brumar_lv was looking for. (Damn---why
didn't we study VP instead of manufacturing processes in this class?)
Jeff

Even for FPDW you'd have to run 444,976 hands which would take

forever

on Lotspiech's calculator, so my mistake for making that suggestion.
Perhaps we can convince Dunbar to post the FPDW N0 (84.14% chance of
winning) number found using a PDF calculator for comparison to the
approximation using normal distribution.

I'll give it a go, but it'll take a few hours to get the kind of
precision you are looking for. Dunbar's Risk Analyzer for Video Poker
solves this type of question by simulation, not pdf analysis.

--Dunbar

dominates ... it happens almost 50% of the time, and the variance of

a RF is extremely high relative to the other hands, is it valid to
apply the CLT to VP?

Yes.

Personally, I think it is, but only for sample sizes hundreds of
times larger than the stat books suggest are needed for it to apply.

For most games I've looked at it takes several million hands for the
distribution of returns to pass reasonably sensitive tests for
normality (actually, not fail). That's probably the basis for claims
that the "long run" is millions of hands that Harry Porter was
complaining about the other day.

A table of gaussian probabilities gives good enough approximations for
considerably smaller numbers of hands, say a few hundred thousand.

Mike

···

--- In vpFREE@yahoogroups.com, "brumar_lv" <brumar_lv@y...> wrote:

I get a probability of being ahead after 444,976 hands of fpdw of
84.15%. That's a nominally exact calculation.

A table of normal probabilities is close enough for this exercise for
this number of hands.

Mike

···

--- In vpFREE@yahoogroups.com, "dunbar_dra" <h_dunbar@h...> wrote:

>
> Even for FPDW you'd have to run 444,976 hands which would take
forever

I'll give it a go, but it'll take a few hours to get the kind of
precision you are looking for. Dunbar's Risk Analyzer for Video Poker
solves this type of question by simulation, not pdf analysis.

Let me see if I can clear this up (and sound like a hypocrite at the same time).

The CLT does apply to VP. But that does not mean the PDF becomes normal. Instead, CLT
says (for VP) that there is a *central region* in which the PDF starts looking normal as the
number of hands increases. The tails of the PDF for VP never (and I mean NEVER) become
normally distributed. So the questions are "how big is the central area" and "how much
probaility (density) is it and in the tails?" not whether the CLT applies. I pretty sure I stated
this in some other post, but maybe not. BTW, in important thing to note is that the width of
the central region grows as the number of hands increases.

···

--- In vpFREE@yahoogroups.com, "jeffcole2003oct" <jeff-cole@c...> wrote:

\> In message #48297, cdfsrule said that the CLT does not apply to VP.
However, this was debated by others (nightoftheiguana2000 and JBQ
for sure), and I'm not sure there was ever a definitive conclusion
drawn. \

>
>
> >
> > Even for FPDW you'd have to run 444,976 hands which would take
> forever
>>
> I'll give it a go, but it'll take a few hours to get the kind of
> precision you are looking for. Dunbar's Risk Analyzer for Video

Poker

> solves this type of question by simulation, not pdf analysis.
>
>

I get a probability of being ahead after 444,976 hands of fpdw of
84.15%. That's a nominally exact calculation.

A table of normal probabilities is close enough for this exercise

for

this number of hands.

Mike

And how did you analyze it?

···

--- In vpFREE@yahoogroups.com, "Michael Peck" <mpeck1@i...> wrote:

--- In vpFREE@yahoogroups.com, "dunbar_dra" <h_dunbar@h...> wrote:

For practical purposes, thinking "long-term" or "CLT" or "normal
distribution" in VP requires to think of high numbers of royal flushes
(and other similar bonuses when relevant): in the "long term", the
primary reason why the distribution is not perfectly normal comes from
them, the variations of the rest of the game become "normal" fast
enough.

As a rule of thumb, one could say that royal flushes in 9/6 JoB
contribute to approximately 80% of the variance - i.e. approximately
90% of the standard deviation.

Eventually the variations of the game "between royals" smoothes out
the curve between the peaks that are caused by the royals - what the
CLT says is that the smoothing happens faster around the center of the
curve than at the edges.

How does that matter in VP? Well, in my opinion the part that matters
is that the primary contribution to the "long-term" shape of the PDF
is the number of royals, and basic probabilities on the number of
royals can give you a decent "long-term" approximation of what to
expect. This is where you see that thinking "long-term" in VP doesn't
require to think in high number of hands, but in high number of
royals, which puts a very different perspective on the game.

JBQ

···

On 1/26/06, cdfsrule <groups.yahoo@verizon.net> wrote:

Let me see if I can clear this up (and sound like a hypocrite at the same time).

The CLT does apply to VP. But that does not mean the PDF becomes normal.

wrote:

> I get a probability of being ahead after 444,976 hands of fpdw of

> 84.15%. That's a nominally exact calculation.
>
> A table of normal probabilities is close enough for this exercise
for
> this number of hands.
>
> Mike
>

And how did you analyze it?

Do you really want to know? It's a combination of a convolution result
from probability theory plus the convolution theorem for Fourier
transforms. It's actually a simple and fast calculation if you can
assume unlimited bankroll and have a reasonably efficient FFT routine
available (the one in Excel doesn't qualify as reasonably efficient).

I almost forgot I had uploaded an example to my web site some time
ago. This <http://www.wildlife-pix.com/vpoker/vpe6jb.png> shows the
distribution of return per unit bet for a million hands of 9/6 Jacks.
If you click on the link the histogram came from a simulation, the
solid red line is the "exact" distribution of returns, and the solid
blue line is a Gaussian with the same mean and standard deviation.

You should be able to see clearly that the true distribution is
slightly skewed from a Gaussian. Basically, compared to a normal
distribution you are more likely to do slightly worse than expected
but less likely to do very much worse than expected, and also slightly
more likely to do very much better than expected. By 4 million hands
or so you'd be hard pressed to see a difference from a normal
distribution.

By the way of course the central limit theorem applies to video poker.
It's a rigorous piece of mathematics and video poker satisfies the
assumptions that make the clt happen. At least it does if the random
number generators used produce truly independent draws, which we all
hope is the case at our favorite casinos.

Mike

···

--- In vpFREE@yahoogroups.com, "deuceswild1000" <deuceswild1000@y...>

--- In vpFREE@yahoogroups.com, "Michael Peck" <mpeck1@i...> wrote:

I think this would be the "simple" answer:
http://mathworld.wolfram.com/CentralLimitTheorem.html

Michael Peck has provided the "pretty picture":
http://www.wildlife-pix.com/vpoker/vpe6jb.png

Every picture tells a story don't it?

···

--- In vpFREE@yahoogroups.com, "brumar_lv" <brumar_lv@y...> wrote:

... is it valid to apply the CLT to VP?
Personally, I think it is, but only for sample sizes hundreds of
times larger than the stat books suggest are needed for it to apply.
Why? Because I've run tests using BDPW that suggest it does apply.
But I've yet to see an adequate explanation of why it does.

--- In vpFREE@yahoogroups.com, "nightoftheiguana2000"
<nightoftheiguana2000@y...> wrote:

> ... is it valid to apply the CLT to VP?
> Personally, I think it is, but only for sample sizes hundreds of
> times larger than the stat books suggest are needed for it to

apply.

> Why? Because I've run tests using BDPW that suggest it does

apply.

> But I've yet to see an adequate explanation of why it does.

I think this would be the "simple" answer:
http://mathworld.wolfram.com/CentralLimitTheorem.html

For the 5480 of the rest of us on this forum, what does this say?

···

--- In vpFREE@yahoogroups.com, "brumar_lv" <brumar_lv@y...> wrote:

Michael Peck has provided the "pretty picture":
http://www.wildlife-pix.com/vpoker/vpe6jb.png

Every picture tells a story don't it?

Do you really want to know? It's a combination of a convolution

result

from probability theory plus the convolution theorem for Fourier
transforms.

Thanks, could I do this, probably not, but I have an awareness of
convolution and am convinced that is the most accurate procedure and
am waiting for a user friendly program to do this.

DWK

···

--- In vpFREE@yahoogroups.com, "Michael Peck" <mpeck1@i...> wrote:

This one tells me two stories:

-Even after a million hands (almost 25 RF cycles), the curve is still
biased: the tip of the curve is offset to the left from the average,
and the foot of the curve is offset to the right. That means that you
could be lucky, hit more royals than expected and end up further ahead
than expected, but that you pay for that potential luck by making most
plays return less than expected - Based on the curve I'd say that the
difference is about 0.03% in return.

-The curve isn't really smooth "yet" - look e.g. at the 4th and 5th
column on the right of the tip. This tells me that even after a
million hands you haven't entirely reached the point where royals are
all that matter.

It's still pretty damn close, in fact it's closer than I expected.
That's 1 million hands, i.e. the order of magnitude of a year of
full-time play in single-line.

JBQ

···

On 1/26/06, nightoftheiguana2000 <nightoftheiguana2000@yahoo.com> wrote:

Every picture tells a story don't it?

Just for the heck of it, it might be useful to throw out some numbers:

The average result of a million hands would be a loss of about .5% x
million = 5,000 bets.

Given that it is largely normalized, one standard deviation would be
sqrt(19.5 x million) = 4400 bets, meaning 68% of results would be from
-9,400 to -600 bets.

Two standard deviations would be 8800 bets, meaning 95% of results
would be from -13,800 to 3800 bets.

N0 is at 19.51467643/(0.995439044-1)^2= 938,101 hands

···

--- In vpFREE@yahoogroups.com, Jean-Baptiste Queru <jbqueru@g...> wrote:

It's still pretty damn close, in fact it's closer than I expected.
That's 1 million hands, i.e. the order of magnitude of a year of
full-time play in single-line.

The number for 2 standard deviations seem overly optimistic and I imagine it would be
interesting to see the actuall numbers from the PDF.

BTW 1,000,000 hands is about 25 Royal Cycles. The Royals should follow a poisson
distribution, with mean = variance = 25 or so. Such a distributions says that there is a
20% chance that there will be 20 or fewer RF's (at cost of relative to the average # of RF of
at least 5*800 = 4000 units) and a 10% chance that there will be 15 for fewer RF (at a cost
relative to the average of 10 * 800 = 8000 units). Hence, I'd guess (and it is a guess, since
I didn't have a chance to check the PDF) that the 95% figure is somewhat optimistic
(-9400-8000 = -17400), simply due to the non-normal tails. But I could be wrong.
Anyone care to check the pdf?

[Aside: While the formula is very simple (see below) it is not an trival thing to compute the
"exact" PDF for so many hands. The problem arrises not so much from the limited
precision of computers, but rather their limited memory. Eventually, the tails of the PDF
will "fold back in" (it is an effect called "aliasing") and distort the PDF somewhat. With so
many hands, care must be taken to avoid this "computational artifact" by applying some-
sort of "filter". Implimenting a win-goal would be one such filter. Unfortunatley, these
types of filters always reduce the total problity in the PDF and hence also distort somewhat
the shape of the PDF. BTW, I don't know what method ("filter") Mike used to compute his
PDF, but I'd guess he did a good job with what ever he did do]

PDF(N) = IFT { FT [ PDF(1)]^n }
where FT = fourrier transform
and IFT is the inverse transform

<nightoftheiguana2000@y...> wrote:

···

Given that it is largely normalized, one standard deviation would be
sqrt(19.5 x million) = 4400 bets, meaning 68% of results would be from
-9,400 to -600 bets.

Two standard deviations would be 8800 bets, meaning 95% of results
would be from -13,800 to 3800 bets.

N0 is at 19.51467643/(0.995439044-1)^2= 938,101 hands

The number for 2 standard deviations seem overly optimistic and I

imagine it would be

interesting to see the actuall numbers from the PDF.

BTW 1,000,000 hands is about 25 Royal Cycles. The Royals should

follow a poisson

distribution, with mean = variance = 25 or so. Such a distributions

says that there is a

20% chance that there will be 20 or fewer RF's

18.5492303% for poisson distribution less than 21
less than 20 is 13.3574834%
more than 30 is 13.6691131%

(at cost of relative to the average # of RF of
at least 5*800 = 4000 units) and a 10% chance that there will be 15

for fewer RF

2.2293021% for poisson distribution less than 16
less than 15 is 1.2402061%
more than 35 is 2.2458086%

25 +/-5 is 72.9734035% for poisson distribution (cf. 68.3% for normal
dist.)
25 +/-10 is 96.5139854% for poisson distribution (cf. 95.5% for normal
dist.)

(at a cost
relative to the average of 10 * 800 = 8000 units). Hence, I'd guess

(and it is a guess, since

I didn't have a chance to check the PDF) that the 95% figure is

somewhat optimistic

(-9400-8000 = -17400), simply due to the non-normal tails. But I

could be wrong.

···

--- In vpFREE@yahoogroups.com, "cdfsrule" <groups.yahoo@v...> wrote:

Anyone care to check the pdf?

Let me see if I can clear this up (and sound like a hypocrite at

the same time).

The CLT does apply to VP. But that does not mean the PDF becomes

normal. Instead, CLT

says (for VP) that there is a *central region* in which the PDF

starts looking normal as the

number of hands increases. The tails of the PDF for VP never (and

I mean NEVER) become

normally distributed. So the questions are "how big is the central

area" and "how much

probaility (density) is it and in the tails?" not whether the CLT

applies. I pretty sure I stated

this in some other post, but maybe not. BTW, in important thing to

note is that the width of

the central region grows as the number of hands increases.

I really appreciate all the excellent replies to my inquiry whether
the CLT can be applied to VP ... including Iggy's. I especially like
the explanation above. I'm finally convinced ... the CLT can be
applied to VP!

If you look at statistical text explanations of the CLT (at Borders
anyway) they state the CLT is applicable if the sample is "large".
Then they state a sample size of 30 is sufficient (no ifs, ands, or
buts)even if the underlying distribution is non-normal. That
presented a problem (to me anyway) because obviously, for VP, 30 is
far too small a number to generate a normal distribution of session
means. That's why I questioned whether the CLT applies to VP.

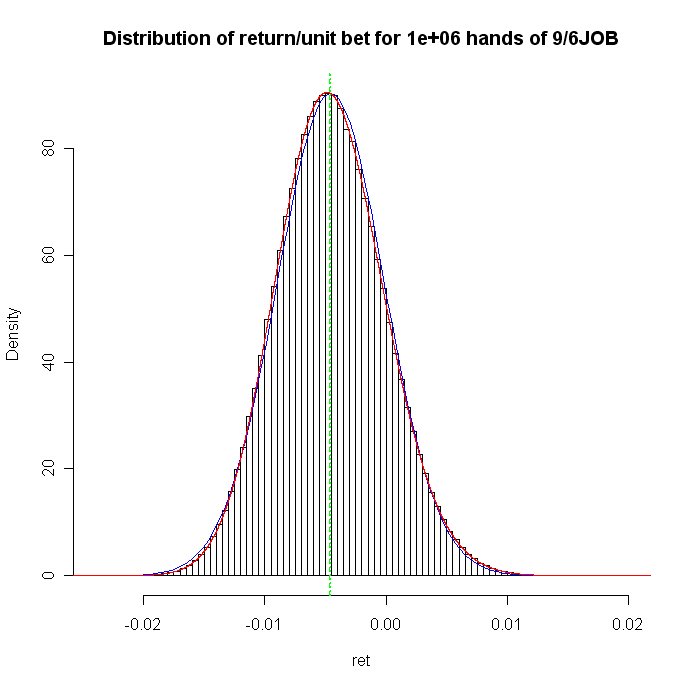
Then I ran a series of 50 tests, at 1 million games each. The
resulting 50 means appreared to be normally distributed (or nearly
so), compared to the CLT calculation for a sample size of 1 million
and the game variance (per BDPW). So I figured the CLT does
(somehow) apply if the sample size is large enough, in spite of
the text books.

So how big is big enough? Does it vary depending on the game
variance? I found it interesting that Iggy's material did not
mention the "30" at all! I think my error was to directly assume a
normal distribution. Is it more correct to say that VP has a
different distribution (binomial or poisson perhaps?) which, at its
limit, approaches a normal distribution as N increases?

···

--- In vpFREE@yahoogroups.com, "cdfsrule" <groups.yahoo@v...> wrote: